Cartography, from the Latin word c(h)art(a), carte and graphy, is the art and science of representing a geographic area graphically. Maps, like all other manifestations of graphic design convey some specific information to an intended audience. Such information can be geographical, socio-political, cultural environmental, agricultural, economical, astronomical and so on . Old maps contain historical information about geopolitics of various eras.
Thus, maps reveal many facts, not only on geography and cartography, but also on the understanding that existed in different historical periods of "time", "epoch / situation" and "world". About the religious and mythological worldview. Of power and politics. The cards create an image in our mind of the world, just like the image that man had of the flatness of the world and represented the earth as a disk. However, today the image that man has of the world is a familiar image of the blue earth seen from the space.

How we "see" this world is very important. "Time" and " epoch / situation" are the most important objects of human cognition. Answers to the question "What is time?" And "What is space?" , based on Copernic astronomy and Heizenberg physics, the answers have become more sophisticated. Our current vision of inside the brain has changed and now integrates the world beyond the brain and the mystical world of particles. Such a perspective allows us to consider that what is going on beyond the brain itself, for example, in an abstact universe, and how it shapes the brain and its neuronal activity, for example, the world-brain relation. This allows us to take into account the mental characteristics that are shaped by the world and the brain and are therefore truly neuro-ecological rather than just neuronal. It leads us to a "direction", that is to say it contains an "orientation".
Babylonian clay tablets from about 2300 B.C. are the most ancient maps that exist today. Map making was essential for wars, and trade, and it was used by ancient Persia, Phoenicia, Cartage, Egypt, China and Greece. Greek philosophers by the time of Aristotle (ca. 350 B.C.) intuited the concept of a spherical Earth. Claudius Ptolemaeus' (Ptolemy, about A.D. 85-165) eight-volume Guide to Geography (Geographike hyphygesis), which remained an authoritative reference on world geography until the Renaissance showed a flat, disc-shaped projection of part of the Earth from about 60°N to 30°S latitudes.
 |
| Persian manuscript celestial globe, ca. 1650. Painted wood. Geography and Map Division, Library of Congress |
Early European maps from the medieval time were influenced by Ptolemy's work however the orientation of these maps were different in that instead of north at the top of a map they placed east. With the expansion of naval trade production of more-accurate maps became possible in the 14th century. The first surviving globe dates from 1492. A Persian painted wooden manuscript depicting celestial globe, ca. 1650 is among the items in the Library of Congress collection in the US. The constellations on this globe were configured according to Islamic astronomy.
W ith the discovery of the American continent new techniques were required for cartography in order to project the curved surface of the globe onto a flat surface. The cylindrical projection of Gerardus Mercator by which landmasses were projected onto a cylinder wrapped around the Earth's Equator was one of these new techniques. With the progress of aerial photography and satellite radar the modern map-making has been revolutionized. Nevertheless, the artistic vision of map designers still play a vital role.
 |
| Psalter map |
Psalter map is attached to a 13th-century copy of the Book of Psalms, hence its name. It is a good example of how maps can convey various messages, in this case some geographical, cultural, geopolitical , and religious information. Conveying the medieval geopolitical belief, at the center of the map is located Jerusalem as the center of the earth. The map represents Christ as the guardian of the world; and shows Moses crossing the Red Sea. The strange figures, some without heads, depicted on the right-hand edge display a cultural belief about the `monstrous' races in Africa.
 |
| The only known example of the Jollain/De Jode edition of Saliba’s map of the cosmos (1582), integrating ancient Pagan and medieval Christian cosmology with Renaissance beliefs and experiences. |
The map also coveys some early geographical information, it depicts the world with an encircling sea and three important rivers Dan, Nile and the Mediterranean which, divide the land into three continents with Asia at the top, Africa bottom right and Europe in the bottom left quarter. The map has east at the top; just below Christ is a depiction of Adam and Eve in the Garden of Eden.
 |
| This scroll, measuring 6.8m x 35cm, is a 12-13th century copy of an original Roman map of the 4th century. Surprisingly, it includes cities such as Pompeii, which had been disappeared off the face of the earth during Vesuvius' eruption in 79AD. Rome. at the center of the map is shown as the hub of the Roman highway system, such as Aurelia highway, which is at the bottom left . The port of Ostia depicted at the bottom is actually to the west of Rome. North Africa is shown at the very bottom, across the Mediterranean sea. |
 |
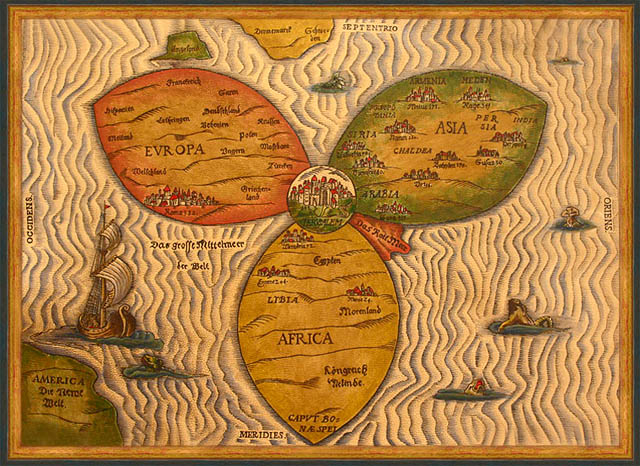
| In this map, from "Itinerarium Sacrae Scipturae", by Heinrich Bunting, 1545-1606, |
Jerusalem is placed in the center of the known world.
 |
| America Sive Novus Orbis Respectu Europaeorum Inferior Globi Terrestris Pars, 1596, Theodore De Bry / Girolamo Benzoni. This a dramatic map design. The New World is depicted in a sphere and at the margins full-length portraits of Columbus, Vespucci, Magellan and Pizarro are shown. |
The cartography for this map is derived primarily from Plancius’ world map of 1594, providing a relatively correct shape for the period and showing a vast southern landmass extending from New Guinea to Tierra del Fuego and beyond. The map accompanies Part six of De Bry's Grand Voyages. It incorporates information acquired by Cornelis Claesz in 1594 from the Lasso chart, showing a single insular Newfoundland. Also incorporated for the first time on an American map is information from White and Le Moyne along the Souteast Coast of North America.
 |
| Ortelius's map of the world, from 1601 |
 |
| Ptolemy's map |
Ptolemy the Greek astronomer created a world map around 150 AD. However, his work was lost until the Renaissance. In 15th century cartographers recreated Ptolemy's map using the information in his eight-volume Guide to Geography.
Ptolemy's map is most detailed round the Mediterranean an area of the world most known to him as he was residing in Alexandria. Only three continents: Europe, Asia and Africa were known to him thus they are depicted in the map.
 |
A hand-colored engraving chart from Andreas Cellarius book Harmonia macrocosmica sev atlas universalis et novus . . . (Celestial Atlas). Amsterdam 1708. This chart from the second edition of the atlas (1708) shows the constellations in the form of Christian saints. This is in contrast to the more rational patterns of classical antiquity which were based on the writings of second century geographer Claudius Ptolemy.
|
 |
The Hampton Roads Region Attractions Interactive Maps
|
Creating a bird's eye view city map illustrations is complicated by the design of the buildings and the best way to depict the landmarks. Viewed from above, most cities are too congested and uniform to make an effective illustrated maps.
 |
| Mount Vernon Baltimore tourist city map. |
In an illustrated map for a cityscape illustration, or city map illustration, the viewer would be able to interpret the buildings and landmarks. The finished cityscape art gives a graphical depiction of what a bird sees from above in an agreeable format.
 |
Geology of the eastern part of the Gulf of Finland in 3D view.. This maps show the location of mineral deposits in relation to various features rock formations
|
 |
| A celestial map from the 17th century, by the Dutch cartographer Frederik de Wit. |
 |
| This is a full-sky map by the |
Wilkinson Microwave Anisotropy Probe (WMAP), which was launched in June of 2001 and has made a map of the temperature fluctuations of the cosmic microwave background (CMB) radiation with the state of the art high resolution, sensitivity, and accuracy. The CMB is the radiant heat left over from the Big Bang. It was first observed in 1965 by Arno Penzias and Robert Wilson at the Bell Telephone Laboratories in Murray Hill, New Jersey.
- See: John Brian Harley, David Woodward, Volume 1 of Cartography in Prehistoric, Ancient, and Medieval Europe and the Mediterranean, Humana Press, 1987, 0226316335, 9780226316338
- Stanford University Image Gallery
- the Wilkinson Microwave Anisotropy Probe (WMAP)


No comments:
Post a Comment