
 Astronomical charts have a long history. This Sumerian star chart, 'Planisphere', engraved on a clay tablet illustrates segments of sky map above Mesopotamia. This 'Planisphere' has been found in the library Ashurbanipal in Nineveh of 650 BC. Long thought to be an Assyrian tablet, computer analysis has matched it with the sky above Mesopotamia in 3300BC and proves it to be of much more ancient Sumerian origin. The tablet is an "Astrolabe", the earliest known astronomical instrument. It usually consisted of a segmented, disc shaped star chart with marked units of angle measure inscribed upon the rim. Unfortunately considerable parts of the planisphere are missing ( approx 40%), damage which dates to the sacking of Nineveh.
This illustration from William Cuningham's The Cosmographical Glasse (1559) represents Ptolemy's conception of the earth-centered universe. Here the Greek god Atlas, attired in the clad of an ancient king, is carrying on his shoulders an an earth-centered universe. The earth is represented by the two elements earth and water and is surrounded by the other two elements of air and fire. Other bands represent the spheres of the planets, the firmament of fixed stars, the crystalline sphere, the primum mobile, and the signs of the zodiac. Below Atlas are lines on cosmological themes from Virgil's Aeneid.

These are pages 2 and 3 of a hand-colored engraving of Reiner Ottens' Atlas maior cvm generales omnivm, Amsterdam 1729. The constellations on this chart are elaborately represented by figures from classical antiquity. In the corners of the chart are illustrations of four European observatories, including that of the noted sixteenth-century astronomer Tycho Brahe (1546-1601).


This image is from a tenth century Greek copy of a noteworthy work by Aristarchus of Samos written in the second century B.C.E. titled "On the Distances and Sizes of the Sun and Moon," in which he calculates the ratio of the distance between Earth and the Sun to that between Earth and the Moon. (His estimate was more than an order of magnitude too small, but the fault was in his lack of accurate instruments rather than in his correct method of reasoning.) This detail compares the line subtending the arc dividing the light and dark portions of the Moon in a lunar eclipse with the relative diameters of the Moon and the Sun. Aristarchus also found an improved value for the length of the solar year.


This Persian astrolabe was made by Hadji Ali, and is a fine example of the astrolabes made in Persia during the Safavid period (A.D.1788/9). Hadji Ali is unique among astrolabe makers as he in numbered ten of the fourteen astrolabes he built. Like modern computers, these astrolabes had removable disks. The disks were placed over the face of the astrolabe. Each disc was used in traveling for a different latitude. On each end of the long arm of the astrolabe there is a sighting hole from which the viewer can look for certain stars and aligning the astrolabe with the north star, a pious Muslim traveler could determine the precise time for his location so as to attend to his/her daily prayers on time. On the back is a sine/cosine quadrant graphs of meridian latitutes for the sun for seven latitudes, graphs of azimuths of numerous stars, a shadow-square, scales of co-tangents, and astrological tables.
 |
| The Globe of the Old World. By Johannes Sabius and Albrecht Dürer, 1515
Note that the globe does not include the most recent geographical discoveries of the Day.
|
 |
| Europe as Queen of Cosmography, crowned by Spain (Hispania) and ruling over the continents of Africa and Asia. In Serbian Münster, Cosmographey (Basel: Henricpetri, 1588: repr. Munich: Köbl, 1977). The first known appearance of this iconography is in a woodcut by Johnnes Putch, Paris, 1537 |
 |
| The Cosmology of the Emerald Tablet of Hermes. In Musaeum hermeticum reformatum et amplifactum (Frankfurt; H. à Sande, 1678) |
Other Scientific Illustrations

An Arabic botanical manuscript from the 15th century, from the Robert Garrett Collection donated to the Boston University in 1942.

Mandragora (Female Mandrake), 1431, Bodleian Library, Oxford University
The manuscripts are written in various styles of the Arabic script and date back to as early as the 13th century. These styles were developed in Timbuktu and the surrounding regions of Mali and West Africa.
Timbuktu's fortunes came crashing down at the end of the 16th century as trade routes shifted, and by the Victorian era it had become a lonely desert outpost.


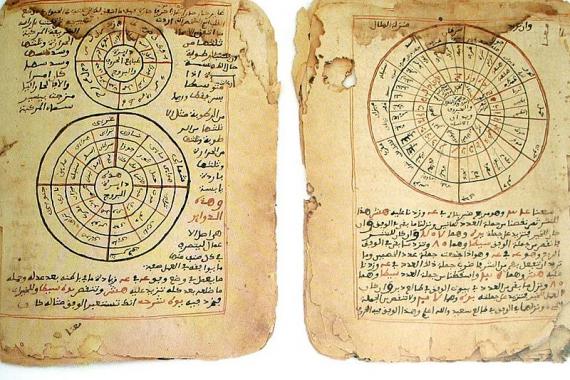
ROMANESQUE MANUSCRIPT, ILLUMINATED, 12th century
Collection of chronological and astronomical manuscripts, from Pruefening near Regensburg, Germany, Oesterreichische Nationalbibliothek, Vienna, AustriaModern Scientific Charts

This graphic chart depicts the time path of the universe since the Big Bang. These types of charts are creatively used in to describe various scientific theories such the expansion of universe through inflation.

Statistical charts are increasingly becoming more important in a modern society. Various computer softwares can easily transform a large set of data into charts, graphs, and statistics of various types in an attempt to provide us with succinct information to make decisions.
Jacques Bertin (1918 -2010), a French cartographer has introduced the term Visual Variable which had a significant influence on the understanding of visual images . His book Semiologie Graphique (1967) systematically classified the use of visual elements to display data and relationships. The encoding of different visual variables to distinguish information, such as colour, size, orientation, shape, texture, value are essential to code any kind of information, but the most important is to choose and apply the most appropriate variable according to the purpose, objective, and audience of the project. In Interview with the digital magazine of InfoVis.net Bertin has said:
Data is transformed into graphics to understand. A map, a diagram are documents to be interrogated. But understanding means integrating all of the data. In order to do this it’s necessary to reduce it to a small number of elementary data. This is the objective of the “data treatment” be it graphic or mathematics. As we have said, the fundamental question is: which are the groups that the data builds in X, and in Y. The construction that responds to this question is the order-able matrix, that re-orders rows and columns and shows the exceptions at the same time. These two pieces of information (the groups in X and Y and the exceptions) are invisible in any other construction.... We shouldn’t forget that the three dimensions of the image make the visual perception our most powerful perceptive system. But images have only three dimensions and the consequences of this limit are important. In that sense, interdisciplinary studies will always be difficult, since the geographer puts the space, the historian, time, psychologists the individuals, sociologists the social categories. What is, the, n the “synthesis science” when each academy, each discipline, each research center is defined by their own X, Y, Z components that characterize their information domain?.This way is how you can show the limits of rationality . A particular treatment is justified only within the boundaries of a well delimited set: the data table. But there is an infinite number of well delimited sets. Our rationalization efforts, whatever they may be, will inevitably drown in the infinitude of the irrational.The following chart shows Bertin's variables of a visual image.

Dynamic designs and computer animation

Dynamic graphics are used to facilitate understanding of concepts in science, engineering, medicine, education, and business. Computer graphics facilitates the production of images that range in complexity from simple line drawings to three-dimensional reconstructions of data. The evolution of a phenomenon through time and its interactions with other elements can be shown through animation. In this 3-D dynamic design a cube is studied from various angles. These type of animations can be very useful in study of various objects. They can also be used to study the evolution of a process through time.The art of dynamic designs is still at its infancy. With the availability of sophisticated computer graphic techniques the horizon has been expanded enormously for the graphic designers.
Go to the next chapter; Chapter 22 - Pioneers of the modern industrial design, The Bauhaus school, Le Corbusier and The American Streamline Style.
Reference
See: Jacques Bertin, Sémiologie Graphique, Les Re-impressions des Editions de l'Ecole des Hautes Etudes En Sciences Sociales 1999, ISBN 2-7132-1277-4
------------------------------------------------------------------------------------

This work is licensed under a Creative Commons Attribution-No Derivative Works 3.0 Unported License.
This work is licensed under a Creative Commons Attribution-No Derivative Works 3.0 Unported License.
No comments:
Post a Comment